Introduction
In India, breast cancer accounts for 23% of all female cancers followed by cervical cancers (17.5%) in metropolitan cities such as Mumbai, Calcutta, and Bangalore. However, cervical cancer is still number one in rural India. Although the incidence is lower in India than in the developed countries, the burden of breast cancer in India is alarming. In the US, breast cancer is the most common form of cancer among women and is the second-leading cause of cancer deaths, after lung cancer. Women in the U.S. have about a 1 in 8-lifetime risk of developing invasive breast cancer. Early detection of breast cancer increases the survival rate and increases the treatment options.
Problem Definition
Screening mammography, x-ray imaging of the breast, is currently the most effective tool for early detection of breast cancer. Screening mammographic examinations are performed on the asymptomatic woman to detect early, clinically unsuspected breast cancer. Two views of each breast are recorded; the craniocaudal (CC) view, which is a top to bottom view, and a mediolateral oblique (MLO) view, which is a side view taken at an angle.
Radiologists visually search mammograms for specific abnormalities. Some of the important signs of breast cancer that radiologists look for are clusters of microcalcifications, masses, and architectural distortions. A mass is defined as a space-occupying lesion seen in at least two different projections. Masses are described by their shape and margin characteristics. Calcifications are tiny deposits of calcium, which appear as small bright spots on the mammogram. They are characterized by their type and distribution properties. Architectural distortion is defined as follows: “The normal architecture is distorted with no definite mass visible. This includes speculation radiating from a point, and focal retraction or distortion of the edge of the parenchyma”.
Thousands of Mammogram Images are evaluated by clinicians each day, but with image sizes in the range of 5000 x 3000 pixels. Manual analysis of mammograms will be a time consuming tedious process for a human examiner. Continuous analysis of different mammograms may lead to inaccurate diagnosis and lead to human errors. In this research, various image processing techniques will be addressed to develop a tool to help these radiologists.
The analysis of mammogram will be useful in the following situations
The differentiating between normal and abnormal tissue.
The Contrast between malignant tissue and normal tissue may be present but below the threshold of human perception.
Avoid biopsy intervention to identify the tissue.
Early Diagnosis and tracking of diseases.
For example, one way you could help the radiologist to quickly locate the suspicious areas would be to produce an image array containing just two shades of intensities, 0 and 255, where 0 represents a normal area and 255 represents a possible suspicious area. In real applications, this type of output is considered a “region-of-interest” (ROI) or “prompting” image, in that it directs the attention of the radiologists to the areas of the image requiring more careful analysis.
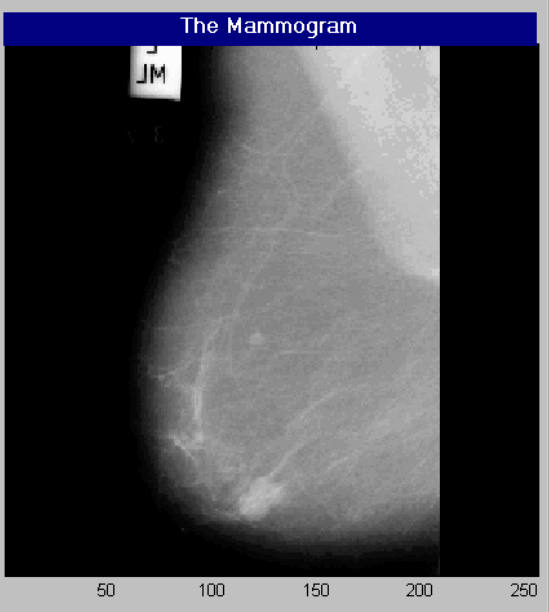
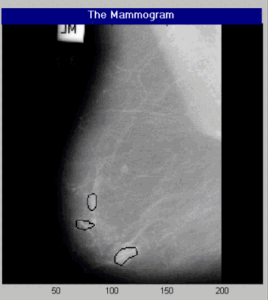
The following diagram shows a typical mammogram image that is used for the clinical diagnosis of breast cancer.
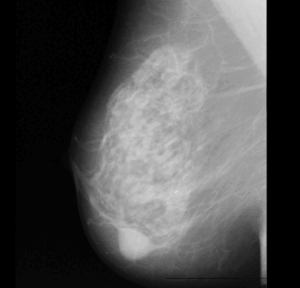
A Typical Mammogram Image
The images for the proposed research will be derived from the online Digital Database for Screening Mammography, located at the University of South Florida (These images were scanned from actual X-ray films taken of women being screened for breast cancer) or Mammographic Image Analysis Society (MIAS) Mini-Mammographic Database. The original MIAS Database (digitized at 50-micron pixel edge) has been reduced to 200-micron pixel edge and clipped/padded so that every image is 1024 pixels x 1024 pixels.
For example, one way you could help the radiologist to quickly locate the suspicious areas would be to produce an image array containing just two shades of intensities, 0 and 255, where 0 represents a normal area and 255 represents a possible suspicious area. In real applications, this type of output is considered a “region-of-interest” (ROI) or “prompting” image, in that it directs the attention of the radiologists to the areas of the image requiring more careful analysis.
Genetic algorithms
Evolution Strategy (ES) was developed at Berlin Technical University by Ingo Rechenberg (1973) and Hans Peter Schwefel (1981). It is an evolution-based process for parameters optimization (finding the maximum of a function). Genetic Algorithm (GA) is a variation of the ES process, which introduces a crossover operation.
Genetic algorithms (GAs) are stochastic global search and optimization methods that mimic the metaphor of natural biological evolution. GAs operate on a population of potential solutions applying the principle of survival of the fittest to produce successively better approximations to a solution. At each generation of a GA, a new set of approximations is created by the process of selecting individuals according to their level of fitness in the problem domain and reproducing them using operators borrowed from natural genetics. This process leads to the evolution of populations of individuals that are better suited to their environment than the individuals from which they were created, just as in natural adaptation. Genetic algorithm-based optimization methods manipulate a string of numbers in a manner similar to how chromosomes are changed in biological evolution. In this research, a GA-based algorithm will be developed to locate tumour/calcification centres in a typical Mammogram image.
About This Project
The purpose of this study is to develop an image enhancement system for computer-aided diagnosis (CAD) of breast cancer using full digital mammography. The proposed system can be used to enhance the mammogram and detect tumour/calcification centres and radius. There are some new image processing methods to extract tumour/calcification masses and clustered microcalcifications have been developed and implemented in the CAD system. A new filter called Iris Filter has been developed to detect tumour/calcification candidates. It realizes reliable detection of tumour/calcification candidates regardless of their sizes and their contrast against their background on mammograms. In this research, apart from the Iris filter, various segmentation and edge detection algorithms are also under consideration. Since the data storage and speed of performance issues are critical in such kind of software design, they also will be taken into account.
About the Implementation.
The working prototype of the application is proposed to be developed and tested in MATLAB using the Image Processing Toolbox under Windows XP operating system in a normal Pentium range of the desktop computer. MATLAB is a high-level scientific and engineering programming environment that allows easy visualization of data, has an extensive library of built-in functions for data manipulation and is widely used in universities and research labs around the world. Since the proposed research addresses various image processing techniques during the design of the proposed system, Matlab will be the suitable platform for such kinds of experiments.
Methodology and System Design
Chromosome representation
If the problem space is defined as continuous space and the tumour/calcification centre location is represented as any points on the space, a set of binary bit strings are comprised to represent a chromosome. The generation is given as follows:
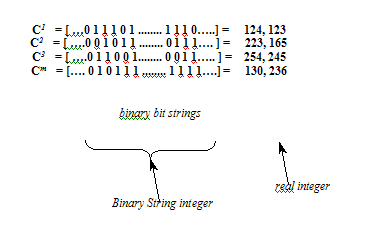
The Binary String Representation of Chromosome
The length of these binary bit strings is determined by the size of the location variables within the problem area, which contains the demand such as the number of tumour/calcification centres required to be found.
Initialization
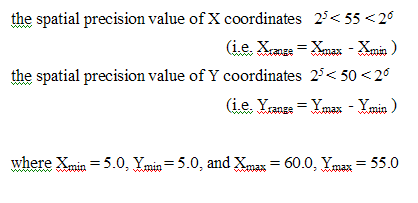
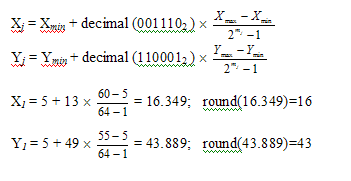
Within the problem space, the initial location of the centres converted from the binary bit chromosomes is randomly selected from the area boundary information. The most simple but computationally effective method is to employ maximum and minimum location values of the area. For example, given the rectangular region, each variable of the solution, an X and Y coordinates of the service centres can take a value from the problem domain, {Xmin, Xmax}, {Ymin, Ymax} and the spatial precision value, Mj, is determined by the X and Y coordinates ranges of demand points, such that it is calculated as follows:
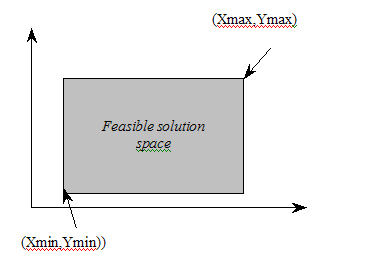
The Problem Space
Then, the total length of a chromosome or a solution set is computed as M1 + M2 (= 12) bits. The mapping from the binary bit strings to a real number for variables Xj and Yj is represented straightforwardly as follows:
The Steps in Genetic Algorithm
Step 1: Initial Population is selected in a random manner or it can be fixed Number.
Step2 : Evaluation: The first step after creating a generation is to calculate the fitness value of each member in the population. The process of evaluating the fitness of a chromosome consists of the following three steps:
2.a ) Convert the chromosome’s genotype to its phenotype. This means converting the binary string into corresponding real values.
2.b ) Evaluate the objective function. Here is the final average value of iris filter output which will be between 0 and 1. If it is near ‘one’, then it is a potential tumour/calcification centre. If it is near ‘zero’, then it will not be a potential tumour/calcification region.
2.c ) Convert the value of objective function into fitness. Here, in order to make fitness values positive, the fitness of each chromosome equals the maximization of the objective function minus the objective function evaluated for each chromosome in the population.
Step3: Objective function values and Fitness: The objective function values F and the fitness values Eval of above chromosomes (the first population) are calculated.
Step4: Create a new population
After evaluation, we have to create a new population from the current generation. Here the three operators (reproduction, crossover, and mutation) are used. The population size is fixed with respect to the convergence factors. For that, the results of previous iterations are taken into account.
4.a) Reproduction: The two chromosomes (strings) with the best fitness and the second-best fitness are allowed to live and produce offspring in the next generation.
4.b)Selection and Crossover: The cumulative probability is used to decide which chromosomes will be selected for crossover. The cumulative probability is calculated in the following steps:
Calculate the total fitness for the population: Pi = Eval(Vi) / F_total;
![]()
Calculate the selection probability Pi for each chromosome:
Calculate the cumulative probability Qi for each chromosome:
![]()
The crossover
The crossover used here is the one-cut-point method, which randomly selects one cut-point and exchanges the right parts of two parents to generate offspring. The crossover point may be selected in a selective manner with respect to the convergence factors.
1. Generate a random number r from the range [0,1];
2. If Qi-1 < r < = Qi, select the ith chromosome Vi to be parent one.
3. Repeat steps 1 and 2 to reproduce parent two.
4. Generate a random number r from the range [0,1]. If r is less than the probability of crossover, the crossover will undergo, the cut-point is selected behind the gene which place is the nearest integers greater than or equal to r+(length-1).
5. Repeat step 1 to step 4 altogether population_size-1 times to finish the whole crossover.
Step 5: Mutation
The mutation is performed after crossover. The mutation level is selected with respect to the convergence factors. The mutation alters one or more genes with a probability equal to the mutation rate.
1. Generate a sequence of random numbers rk . (Here, the numbers of bits in the whole population).
2. If ri is 1, change the ith bit in the whole population from 1 to 0 or from 0 to 1.
3. The chromosomes reproduced are not subject to mutation, so after mutation, they should be restored.
A new population is created as a result of completing one iteration of the Dynamic Genetic Algorithm. Go to step2.
The procedure can be repeated as many times as desired. The best value of the objective function in each generation is evaluated. And the whole process is repeated up to the required number of times.
The Flow Diagram showing GA Operations
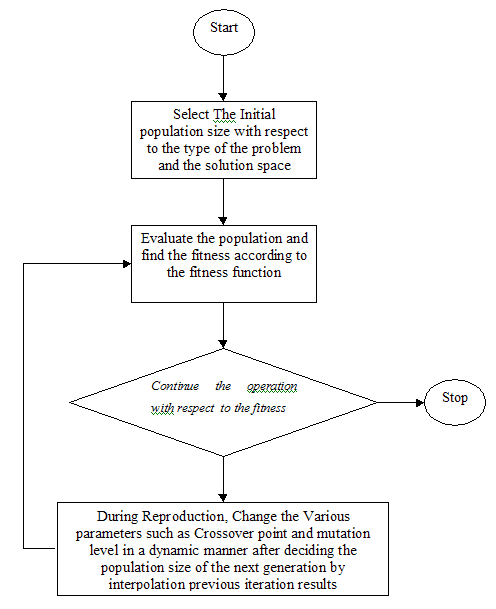
The Flow Chart
Iris Filter
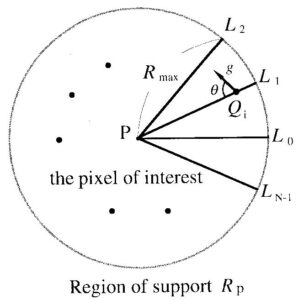
In this research, Lloyd-Max Quantization is used as a preprocessing step for segmenting the mammogram image from its background. The segmented image is then processed by using an iris filter. tumour/calcifications can be recognized as local low-density areas on the image. Their absolute values, however, are not constant and they vary in size, background variations, imaging conditions, and so on. Malignant tumours, however, exhibit at times very weak contrasts to their background. We have developed a new type filter called the iris filter for the detection of approximately rounded convex regions. Performance does not depend on the contrast, thus, opacities with very weak contrast can be enhanced clearly. The first processing step consists of the detection of tumour candidates for malignant tumours on the image.
The sum of the cosine of differences of angles (angles between the line connecting the origin and the gradient vector of every point) will be early equal to 1 if it is a tumour centre or it will be near to zero if it will not be a potential tumour region.
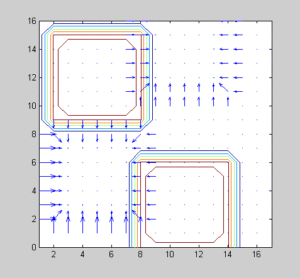
1) If the gradient vector field is uniform, the iris filter shows a near-zero output.
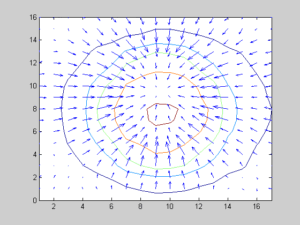
2) The theoretical output of the iris filter for a rounded convex region is shown in the above figure. This is defined here as a region whose intensity equicontours are concentric. Also, all gradient vectors point toward its centre. A half-sphere is a good example. The output level at the boundary is, regardless of the contrast between the rounded convex region and the background in the original image. The artificial image has an intensity profile just similar to a Gaussian probability density function.
3) The theoretical output for a semicylindrical region is shown in the figure. This is defined here as a region where equicontours are parallel to the central line of the semi-cylindrical region. As shown in the figure, the filter output on the central line is the maximum in the semicylindrical region, but it is at the boundary. The theoretical analysis shows that a rounded convex region can be detected using a threshold between and 1, thus, semicylindrical opacities cannot be theoretically detected. A rounded convex region and a semicylindrical region are simplified models of tumours or elongated objects such as blood vessels, mammary ducts, and others, respectively. They are, unfortunately, not necessarily equal to the ideal models and results of the theoretical analysis cannot be applied directly to the real Mammogram Images. Nevertheless, the iris filter is an effective filter for enhancing tumours with a large variety of radiological appearances, as viewed through confusing backgrounds of normal structures.
2.6 The Iris Filter Operation with Artificial Images
Applying Iris Filter with Artificial, Tumor-Like Test Image
The most important step in the proposed tumour segmentation method is the Iris filter. The following results explain the property of the iris filter. As already explained, the iris filter will produce values greater than zero if we operate it on the tumour region. The following (left) artificial image represents a tumour. On the left-hand side, the tumour was shown in actual size and in the right-hand side, it was shown in magnified form. The right figures show the Contour Plot with gradient vectors of the above artificial image.
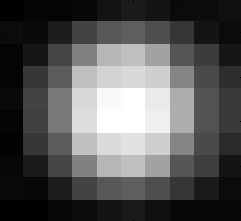
Image Size 10 X 10 pixels
Gradient vector of Tumor-Like Image
The Gradient Vectors of the Above Image
The following matrix of numbers is the corresponding values of the iris filter output.
The Numerical Values of Iris Filter Output (Filter Radius – 4)
0.2144 0.2885 0.3503 0.4027 0.4018 0.3532 0.2789 0.2264 0.1877
0.2645 0.3323 0.4257 0.5045 0.5060 0.4325 0.3385 0.2694 0.1887
0.2907 0.4312 0.5984 0.7048 0.7094 0.6096 0.4455 0.3070 0.2371
0.3686 0.5669 0.7591 0.8753 0.8790 0.7709 0.5940 0.3951 0.2922
0.4327 0.6497 0.8545 0.9741 0.9851 0.8779 0.7027 0.4798 0.3388
0.4263 0.6403 0.8481 0.9665 0.9783 0.8711 0.6882 0.4723 0.3281
0.3567 0.5557 0.7453 0.8611 0.8714 0.7621 0.5824 0.3891 0.2770
0.2898 0.4231 0.5772 0.6745 0.6846 0.5900 0.4347 0.3107 0.2433
0.2630 0.3113 0.3870 0.4601 0.4655 0.4010 0.3128 0.2576 0.2195
As shown in the above matrix, the values are almost greater than zero since the image is a tumour-like candidate.
Applying Iris Filter with the Artificial image with non-tumour like area.
The following artificial image is not a tumour image. In left-hand side is shown in magnified form. The right side figures show the Contour Plot with gradient vectors of the artificial image.
on Tumor-Like Image Size 10 X 10 pixels
Gradient vector of non-Tumor Like Image
The following matrix of numbers is the corresponding values of the iris filter output.
The Numerical Values of Iris Filter Output (Filter Radius – 4)
-0.0005 -0.2230 -0.4922 -0.4460 -0.2497 0.0177 0.2873 0.2191 0.0965
-0.0005 -0.2230 -0.4378 -0.3924 -0.2015 0.0269 0.2793 0.2601 0.1192
-0.1030 -0.2822 -0.4656 -0.4483 -0.2101 0.0794 0.3211 0.3449 0.2393
-0.1959 -0.3463 -0.5119 -0.4449 -0.2431 -0.0002 0.1712 0.2061 0.1572
-0.1240 -0.2053 -0.3525 -0.2980 -0.1389 0.0827 0.1586 0.1408 0.0436
0.0844 0.0561 -0.1460 -0.2070 -0.1225 0.0037 0.0315 -0.0200 -0.1072
0.2036 0.2111 0.0708 -0.0118 0.0401 0.1152 0.1054 -0.0444 -0.2072
0.3493 0.3534 0.2392 0.1354 0.1949 0.2639 0.2648 0.1446 -0.0529
0.2792 0.2599 0.1189 0.0876 0.2525 0.3272 0.3627 0.2632 0.0193
As shown in the above matrix, the values are almost near zero or less than zero since the image is not a tumour-like candidate.
The Block Diagram Showing Image Segmentation Phase for Segmenting Potential Tumors Region.
Segmentation Phase
The Block Diagram Showing The Filter Process of Isolating Tumors from its surroundings.
Filtering Process
Implementation Results and Discussion
The results with Mammogram Images
The Image File Name: mdb005.bmp
Matlab Command Window Outputs
The Resized Image File Size: 256 x 256
Applying Lloyd-Max Segmentation…
Segmentation Level: 3
Separating the Image From Background using the Segmented Image.
Segm.Levels used for Mask: 2
Results with Normal Method
The Detected Potential Tumor Regions on the Mammogram Image using Normal Method.
The GA Parameters:
The Total Population Size: 30
The Total Number of Generations: 300
The Mutation Level: 0.20
The Crossover Rate: 0.20
Locating Tumors Using GA ….
Finished.
Applying Iris Filter Using Masked Image as per the Proposed Method
The Iris Filter Radius: 10
Time Taken for Applying Iris Filter: 2.60Sec
The Final Result:
The Expected Circumference of the Potential Abnormal Regions: 20 Pixels
The Detected Abnormal Regions: 2
>>
The Detected Potential Tumor Regions on the Mammogram Image using Proposed Method.
The Detected Calcification Regions
Step by Step Results –Proposed Method

Step by Step Results
Conclusion and Scope for Enhancements
The Iris Filter based image processing tool has been successfully implemented to detect tumour candidates. The performance of the proposed GA-based method was very good in terms of speed while comparing it with the normal search method. The segmentation phase considerably reduces the time by reducing the space in which the filter operation will be done.
The proposed method was very much suitable to detect tumour-like calcification areas in the mammogram. Calcification was partially detected most of the time. The system can be used to enhance the Mammogram images and detect tumours and other related problems. It realizes reliable detection of tumour candidates regardless of their sizes and their contrast against their background.
The system was able to detect the tumour boundaries in most of the cases. But it also detected some of the false positives which are having peculiar shapes and intensities.
 Take Me to Afarion ns-3 iPlayground