Tracegraph tool can be used to do trace analysis on trace output of a single run of the simulation. So it is an elementary thing. It is only to demonstrate some basic outputs of simulation. Further, one can not use this kind of simple trace analysis for serious projects or research works. Because, in such a simulation scenario, a simulation will get executed several times with different parameters and will generate a lot of trace files. In such cases, one should develop custom awk scripts or Perl scripts and shell scripts for doing complex trace analysis to prepare tables and graphs.
So, if you are doing a Ph.D research or even a UG/PG project, then forget about using Tracegraph. It is useless in such cases because, you can not generate genuine, quality results/outputs using this tool.
Using Tracegraph tool
The following procedure shows the way to do some elementary trace analysis under Matlab using the Tracegraph tool :
About Software versions used :
1. We can use ns2.28 or higher for the proposed simulation (even it will run under some lower versions also).
2. We are using the new version of Tracegraph Version 2.05. We can get it from the following link.
http://www.tracegraph.com/Tracegraph205_win.zip (now it is a dead link – try to get it from somewhere else)
3. We are using the new version of Trace Converter Version 1.01. We can get it from the following link.
http://www.tracegraph.com/trconvertwin.zip
4. Matlab 6.5 can be used to run the source version of Tracegraph.
We will use a trace converter because Tracegraph could not handle the trace file generated by the wired cum wireless scenario.
Refer Internet for further information about Tracegraph and trace converter.
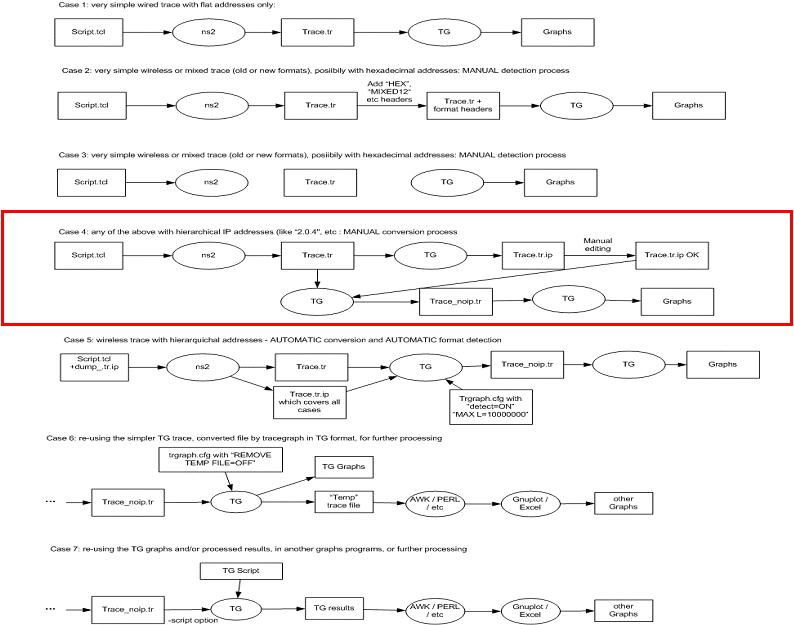
Diagram Explaining the Simulation and Analysis Steps.
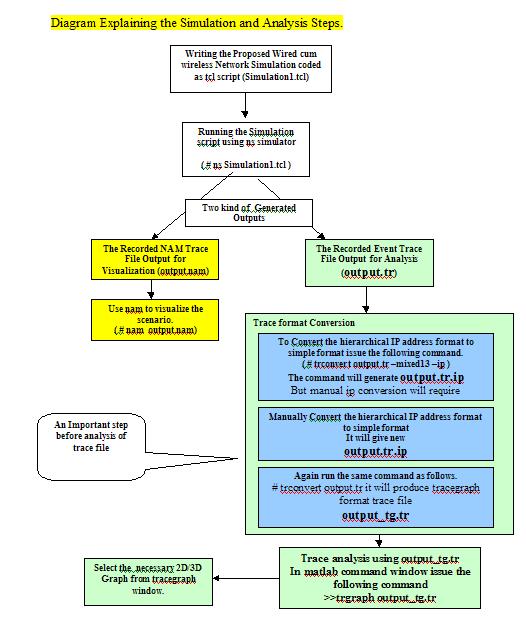
The highlighted model (Case – 4) in the following diagram shows the simulation and analysis using we are using in this example. Since we are using hierarchical addressing in wired cum wireless scenario, Manual IP conversion is required.
Installation of software that is required for this experiment:
1. Install ns2.28 or higher in Linux or Windows (Cygwin) (it is a long procedure. Refer to the internet for installation problems)
2. Install trace converter, preferably windows binary version
3. Install the Tracegraph, preferably Matlab source version for windows. And run it from inside the Matlab command window.
(For Running binary version of windows we have to do a lot of things. It will not require Matlab. But it will require some Matlab runtime environment components)
Doing the Experiments
1. Run any example simulation script (simulation1.tcl) in a terminal window using ns simulator as follows (here we assume that the trace file outputs are logged in the file (output.tr).
#ns simulation1.tcl
It will produce two files as output. They are output.nam and output.tr.
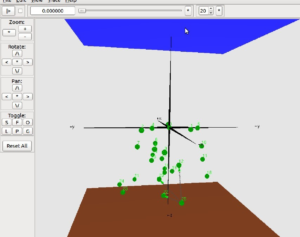
2. To visualize the scenario use nam as follows.
#nam output.nam
4. To do trace analysis using the Tracegraph, we have to do the following.
4a) copy the output.tr into the trace converter directory. Run a terminal window and change to the trace converter directory and issue the command as follows.
(if you are having trace converter installed under D drive )
D:trconvertwin>trconvert output.tr -mixed13 -ip
Converting output.tr trace file…
IP file (output.tr.ip ) does not exist.
Extracting IP addresses from output.tr …
IP addresses have been saved to output.tr.ip
IP addresses to node numbers manual conversion are needed (see help).
output.tr has not been converted.
4b) Since manual conversion is needed, edit the file output.tr.ip as explained in the following section.
5. Again run the trace converter to convert the ns trace file to the Tracegraph – It may produce an output as follows :
D:trconvertwin>trconvert output.tr
Trying to recognize the format of output.tr trace file…
10000 lines have been processed to recognize trace format.
wired-new trace format has been detected
IP addresses have been detected
Converting output.tr trace file…
output.tr has been converted to output_tg.tr
Finally, we will have the trace file for The Tracegraph, output_tg.tr
5. Copy the file output_tg.tr to trace the graph directory.
6. Run Matlab and set Matlab path to trace graph directory (example: D:Tracegraph205_winTracegraph205Windows).
7. In the Matlab command window issue the following command
>> trgraph output_tg.tr
8 In the Tracegraph window, select the necessary menu for displaying necessary graphs and statistics
A simple example of ns2 Hierarchical IP address to Tracegraph IP format conversion (manual).
1. Copy the output file output.tr in Traceconvert directory and issue the ‘trconvert. command from the same directory. It will produce output as follows :
# trconvert output.tr -mixed13 –ip
Trying to recognize format of output.tr trace file…
10000 lines have been processed to recognize trace format.
wired-new trace format has been detected
IP addresses have been detected
Converting output.tr trace file…
IP file (output.tr.ip ) does not exist.
Extracting IP addresses from output.tr …
IP addresses have been saved to output.tr.ip
IP addresses to node numbers manual conversion are needed (see help).
output.tr has not been converted.
It will produce the following output file ‘output.tr.ip’ in the same directory – and it may like as follows.
1.0.1
1.0.2
4194304
4194305
4194306
2. Since manual conversion is needed, manually assign suitable IP address for a hierarchical ip address.
Now the output file ‘output.tr.ip’ will look as follows.
1.0.1 2
1.0.2 3
4194304 4
4194305 5
4194306 6
3. Using the new ‘output.tr.ip’ again run the same command as follows
# trconvert output.tr
now it will convert the ns output trace file output.tr to Tracegraph format trace file output_tg.tr. Now using this file we can do trace analysis on the Tracegraph.
Procedure for Trace Analysis.
Trace analysis using output_tg.tr
Copy the output_tg.tr file from the Traceconvertor directory to Tracegraph directory.
If you are using the source version of the Tracegraph, run Matlab (preferably 6.5) and change to the Tracegraph directory in the Matlab directory window(left top text box).
In Matlab command window issue the following command
>>trgraph output_tg.tr
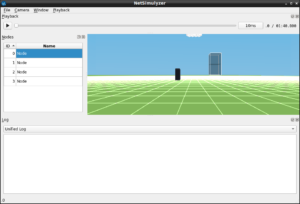
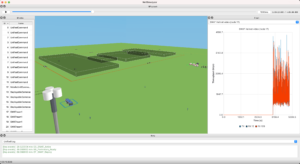
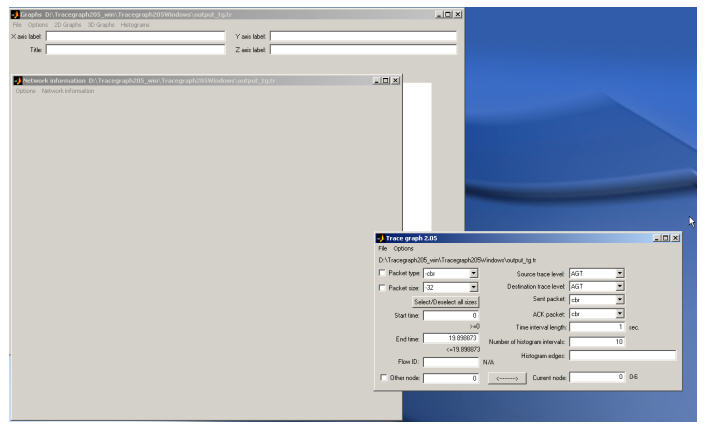
After a few seconds or minutes (depending upon the magnitude of the problem and speed of the computer) the windows similar to that following will appear.
In this following example,
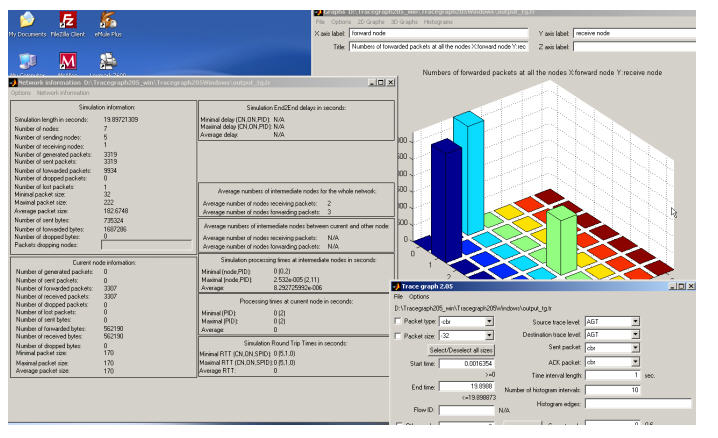
In the right bottom window, you can select some parameters.
In the top window, you can select the necessary graphs.
In the left middle window, you can select some statistics.
The following screen shows an example of one of such typical analysis results.
Note :
This tool is very very old and will not be suitable for doing trace analysis for your research level simulations. For that, you may need to do some custom trace analysis by writing your own custom shell scripts, awk scripts. If you are a research student or a scholar, then simply forget about using this primitive, outdated tool.
Read more about trace analysis of a ns-3 simulation in the following link:
Trace Analysis of TCP Flows Under ns-3 MANET/ FANET/ VANET/ WSN Scenario
Trace Analysis of TCP Flows Under ns-3 MANET/ FANET/ VANET/ WSN Scenario
 Take Me to Afarion ns-3 iPlayground