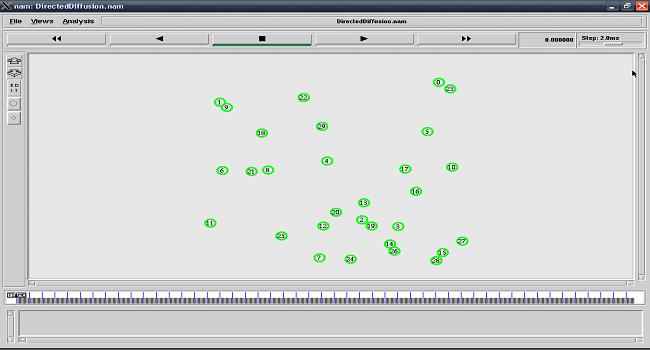
The following NAM instanced of a typical wireless sensor network simulation shows the Visualization of Energy of the Nodes.
The following is a 30 Node Scenario using Directed Diffusion Protocol.
While starting the simulation, all the nodes are having sufficient battery energy.
In the following NAM output instant, the Green colour of the nodes signifies the sufficient Battery Energy at the nodes (According to the Power Model of ns2)
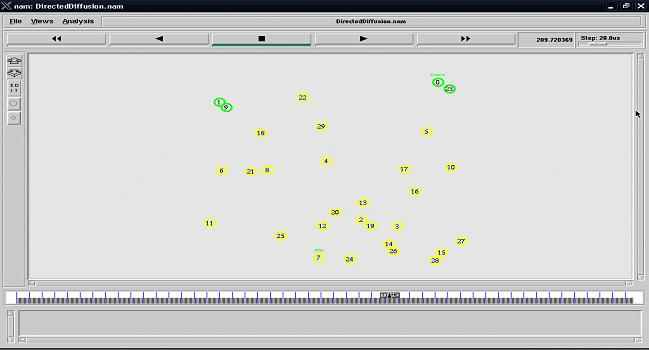
After some time the energy at some nodes started to drain and reaches a low level.
In the following NAM output instant, the Yellow Colour signifies that the Battery Level is Low (According to the Power Model of ns2)
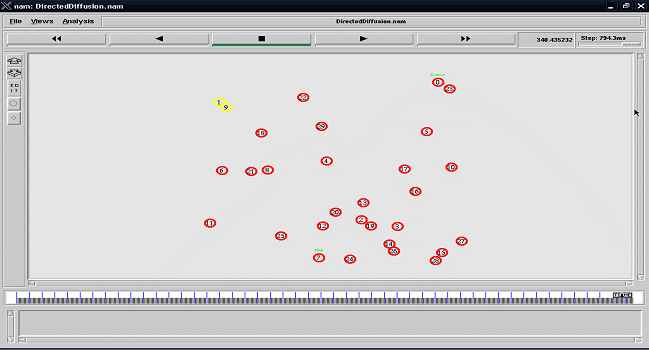
After some more time, the energy at some nodes started to reach a critical level and fully drained state.
In the following NAM output instant, the Red Colour signifies that the Batteries are Drained (According to the Power Model of ns2)
 Take Me to Afarion ns-3 iPlayground