The Important Sections of TCL Script Used for the Simulation
Some of the Important Parameters
set val(chan) Channel/WirelessChannel ;# channel type
set val(prop) Propagation/TwoRayGround ;# radio-propagation model
set val(ant) Antenna/OmniAntenna ;# Antenna type
set val(ll) LL ;# Link layer type
set val(ifq) Queue/DropTail/PriQueue ;# Interface queue type
set val(ifqlen) 50 ;# max packet in ifq
set val(netif) Phy/WirelessPhy ;# network interface type
set val(mac) Mac/802_11 ;# MAC type

set val(initeng) 2 ;# Initial energy in Joules
set val(txPower) 0.660
set val(rxPower) 0.395
set val(idlePower) 0.035

set val(rp) AODV
set val(TotalNodes) 10
set val(x) 500
set val(y) 500

set val(mobility) off

set val(StartTime) 0.00
set val(SimTime) 100.00
Setting Default Node Parameters
set chan_1 [new $val(chan)]


$ns node-config -adhocRouting $val(rp) \
 -llType $val(ll) \
 -macType $val(mac) \
 -ifqType $val(ifq) \
 -ifqLen $val(ifqlen) \
 -antType $val(ant) \
 -propType $val(prop) \
 -phyType $val(netif) \
 -topoInstance $topo \
 -agentTrace ON \
 -routerTrace ON \
 -macTrace ON \
 -movementTrace OFF \
 -channel $chan_1 \
 -energyModel EnergyModel \
 -initialEnergy $val(initeng)
Create Nodes and Set Some Mobility
 for {set i 0} {$i < [expr $val(TotalNodes) ] } {incr i} {
 set node($i) [$ns node $i]
 $node($i) random-motion 0 ;# disable random motion
 $god new_node $node($i)
 set tx [$rng integer [expr $val(x) - 100 ] ]
 set ty [$rng integer [expr $val(y) - 100 ] ]
 set tx [expr $tx + 50 ]
 set ty [expr $ty + 50 ]
 $node($i) set X_ $tx
 $node($i) set Y_ $ty
 $node($i) set Z_ 0.0
 $node($i) color "black"
 $node($i) set enetgy 3
 $ns initial_node_pos $node($i) 20
 }

# set the position of the sender and reciever at two extreem ends
set x 50
set y [expr $val(y) - 50 ]
$node(0) set X_ $x
$node(0) set Y_ $y
$node(0) set Z_ 0.0
$ns initial_node_pos $node(0) 20
$ns at 0.0 "$node(0) setdest $x $y 20000.0"
$ns at 0.0 "$node(0) label Source"
$ns at 0.0 "$node(0) color blue"

set x [expr $val(x) - 50 ]
set y 50
set n [expr $val(TotalNodes) -1 ]
$node($n) set X_ $x
$node($n) set Y_ $y
$node($n) set Z_ 0.0
$ns initial_node_pos $node($n) 20
$ns at 0.0 "$node($n) setdest $x $y 20000.0"
$ns at 0.0 "$node($n) label Sink"
$ns at 0.0 "$node($n) color blue"

if {$val(mobility) == "on" } {
 for {set i 0} {$i < [expr $val(TotalNodes) ]} {incr i} {
 set tx [$rng integer [expr $val(x) - 100 ] ]
 set ty [$rng integer [expr $val(y) - 100 ] ]
 set tx [expr $tx + 50 ]
 set ty [expr $ty + 50 ]
 $node($i) random-motion 1
 $ns at 0.0 "$node($i) setdest $tx $ty 20.0"
 }
}
Setup Traffic Flows Between Nodes
#
# CBR connections between node(0) and node(1)

set udp [new Agent/UDP]
$udp set class_ 2
set sink [new Agent/LossMonitor]

$ns attach-agent $node(0) $udp
$ns attach-agent $node([expr $val(TotalNodes) -1 ]) $sink
$ns connect $udp $sink

set cbr [new Application/Traffic/CBR]
$cbr set class_ 2
$cbr set packetSize_ 1024
$cbr set interval_ 0.05

$cbr attach-agent $udp

$ns at 0.003 "$ns set-animation-rate 0.005"


$ns at 0.0 "$ns trace-annotate \"0.001 :Simulation Started\""
$ns at 0.000 "$ns set-animation-rate 0.0001"

$ns at 0.001 "record"
$ns at 0.002 "$cbr start"


$ns at $val(StartTime) "$cbr stop"
$ns at $val(SimTime).01 "stop"

set T 6.0
 for {set i 0} {$i < [expr $val(TotalNodes) ]} {incr i} {
 set pe($i) [$node($i) energy]
 set Alpha($i) 0.3
 set DRold($i) 0.0
 set DRsample($i) 0.0
 }
Periodically Record Events
proc record {} {
 global val node Powerfd DrainRatefd T pe Alpha DRold DRsample
 #Get An Instance Of The Simulator
 set ns [Simulator instance]

 #Set The Time After Which The Procedure Should Be Called Again
 set time $T
 #Get The Current Time
 set now [$ns now]
 for {set i 0} {$i < [expr $val(TotalNodes) ]} {incr i} {
 set ce [$node($i) energy]
 puts $Powerfd($i) "$now $ce"


 set DRsample($i) [ expr ( $pe($i) - $ce ) / $T ]
 set DRi [expr $Alpha($i) * $DRold($i) + ( 1 - $Alpha($i) ) * $DRsample($i) ]
 set DRold($i) $DRsample($i)

 puts $DrainRatefd($i) "$now $DRi"

 }


 #Re-Schedule The Procedure
 $ns at [expr $now+$time] "record"

 }
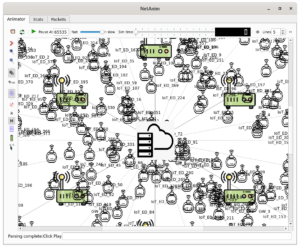
The Simulation output Visualized in NAM
All the Nodes are deployed with some minimum Battery Energy ( 2 Jules as initial energy)
The coloring of nodes will be made automatically by the Energy Mode of ns-2.
The Energy level shown as Green Color signifies Good Battery Energy level.
Data Transfer Starts from Source to Sink :
(Source and Sink were shown in Blue)
The Nodes that were actively participating in data transfer are getting drained faster than other nodes and becomes yellow.
This color change will be automatically managed by Energy Model of ns-2.
The power drain is shown in Yellow.
Since the communication is happening through the same nodes, it is using power continuously and finally come to a Drain Condition.
The fully drained nodes are automatically marked in red by the energy model of ns-2 and become inactive.
After that, alternate route will get discovered over some other nodes and the data transfer will resume.
After some more time, almost all the nodes in the network come to drain state so that there will not be any further data transfer happen.
The node entirely lost its power were maked in red by the energy model of ns-2
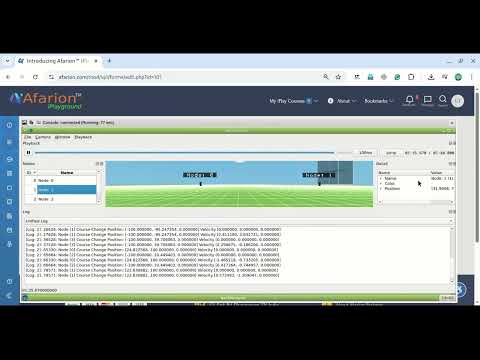
Visualizing Energy Consumption and Drain Rate using Graphs.
The Node Energy Vs Time Graph
The following graph shows the battery energy level of all the nodes over time.
The Drain Rate Graph
The following graph shows the drain rate of all the nodes over time.
Summary :
We have implemented a suitable network scenario to study the energy consumption characteristics of typical network.
 Take Me to Afarion ns-3 iPlayground