PyViz
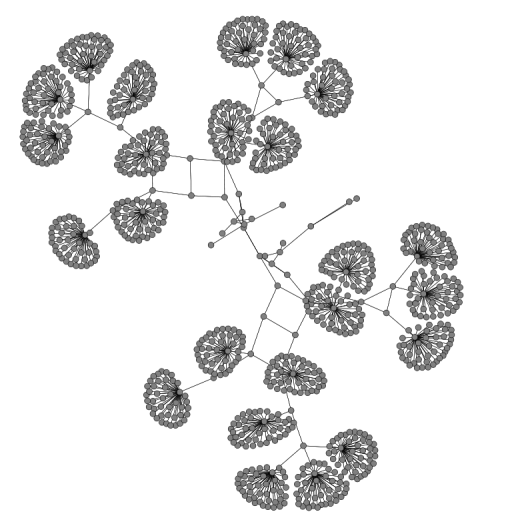
Unlike the offline animation tool NetAnim, PyViz is a live simulation visualizer for visualizing ns-3 simulation. It was developed by Gustavo Carneiro[3]. It is written in Python and can be used to visualize both Python and pure C++ simulations. PyViz can be used to debug the state of the running objects, to figure out if mobility models are what you expect, and to see where packets are being dropped. The image at right (from the tutorial at [3]) shows the possibility of visualizing a network graph with PyViz.
It works by attaching Python probes to the ns-3 objects that you want to visualize. These probes collect data about the objects, such as their position, velocity, and packet traffic. PyViz then uses this data to create a live visualization of the simulation.
It is a powerful tool for debugging ns-3 simulations. It can help you to identify problems with your simulations and to understand how they are working. PyViz is also a useful tool for visualizing the results of your simulations.
Uses of PyViz :
- It can be used to debug the state of the running objects.
- It can be used to figure out if mobility models are what you expect.
- It can be used to see where packets are being dropped.
- It can be used to visualize the results of your simulations.
Plugins
Plugins can be used to add new features, such as the ability to visualize different types of data, or to modify the behaviour of the visualizer. Plugins typically connect to a set of “signals”. For example, it is possible to do some action on the GUI in the event of a particular mouse behaviour. More information about plugins can be found at [1]
Limitations
In [1], the following are mentioned as known problems with this visualizer :
- LTE devices do not support PyViz yet.
- You cannot use a PyViz with simulations that require emulation (EmuNetDevice, TapNetDevice) or real-time scheduler (RealTimeSimulator).
Design of PyViz
The following diagram from[1] explains the design of PyViz.
PyViz uses Gtk+ and GooCanvas for the GUI part, and also accesses the ns-3 API directly, all via respective Python bindings[1].
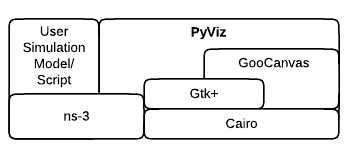
PyViz Design- Image from[1]
The following diagram from[1] shows the way in which PyWiz interacts with a running simulation and produces a graphical output for visualization.
This live simulation and visualization are accomplished by using threads: in the main thread, the GUI is kept updated, and in a separate thread the simulation is run. Updates happen in slices of 100 ms.
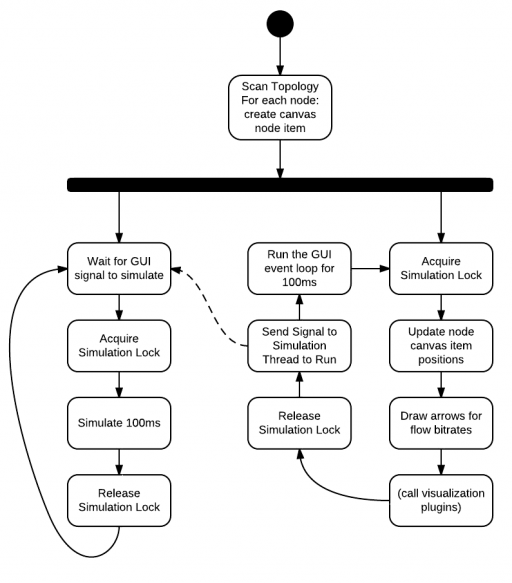
PyViz -Live, Interactive Simulation Design- Image from[1]
Installation of PyViz
This Procedure explains the installation on Debian (or Debian variants such as Ubuntu). Detailed instructions for different platforms can be found at [1].
To use PyViz, you need to have Python installed on your system. You also need to have the ns-3 Python bindings installed.
In order to have a Console button in the visualizer GUI, we may need to install interactive Python:
Running a Simulation with PyViz
On ns-3.5 and previous versions of ns-3, we may run a simulation with PyViz using the script ‘waf’ as follows:
On ns-3.5 and later versions of ns-3, we may run a simulation with PyViz using the script ‘ns3’ as follows:
Possible Errors
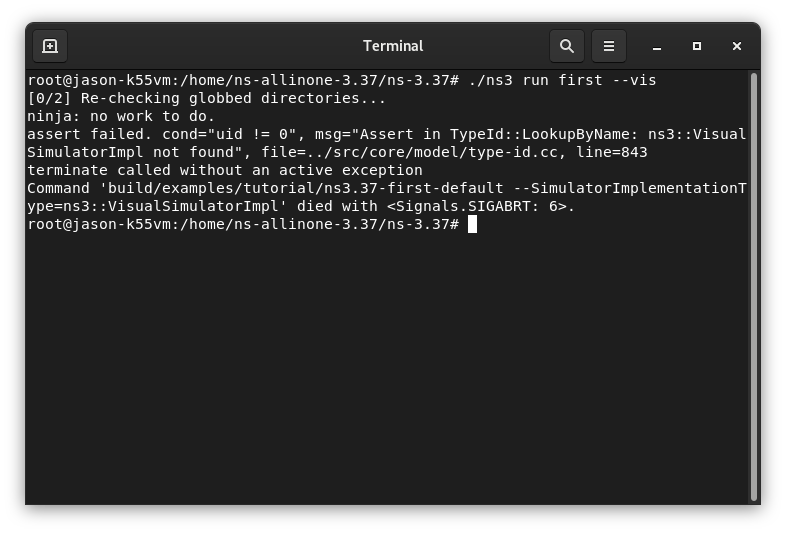
For example, while trying to run a simulation with PyViz on a pre-exzisting ns-3.37 installation, I received the following Error.
ns3::VisualSimulatorImpl not found
First, we have to check whether ns-3 is compiled with visualization support or not.
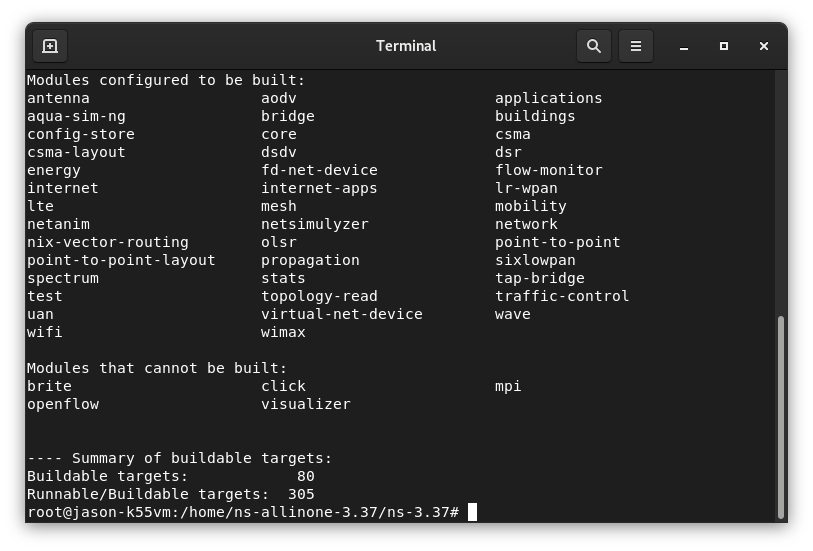
If we carefully notice the list of modules configured during the previous installation, we can find that the visualizer module is missing. So we have to recompile ns-3 with it.
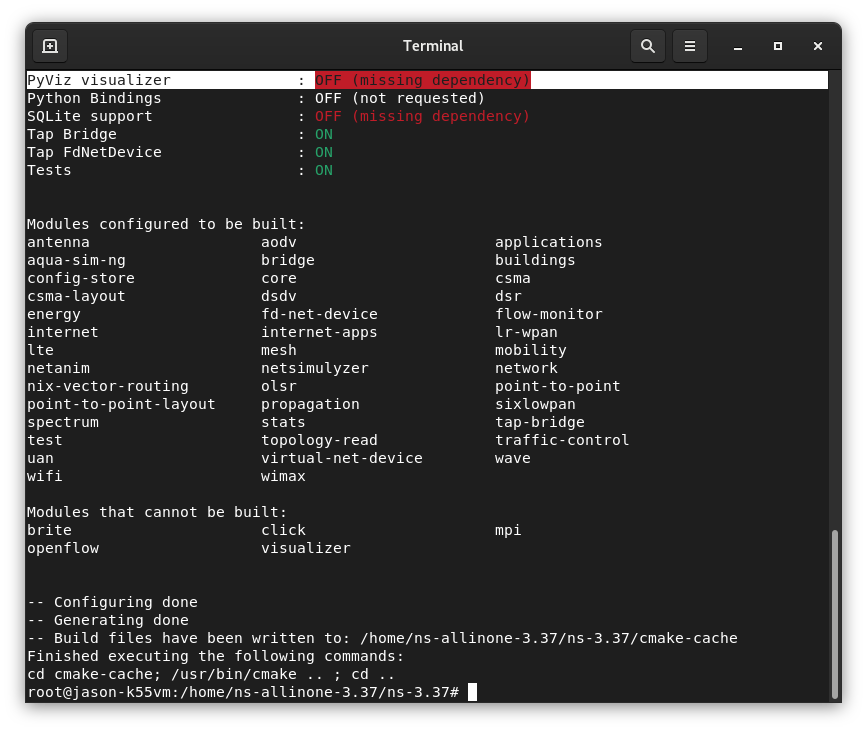
Even after installing the required dependencies, your configuration may still miss configuring ‘visualizer’ module and you will see it at the “modules could not be configured’ list at the bottom.
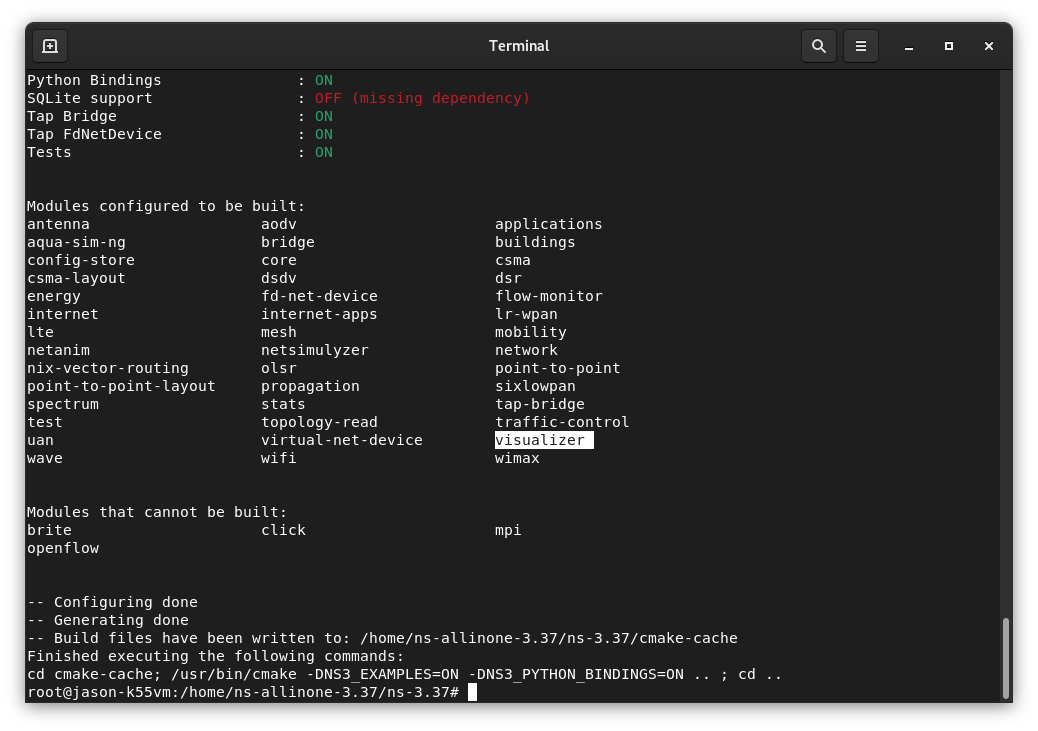
Now we can see the ‘visualizer’ module in the list of ‘Modules configured to be built’
Compile ns-3 again
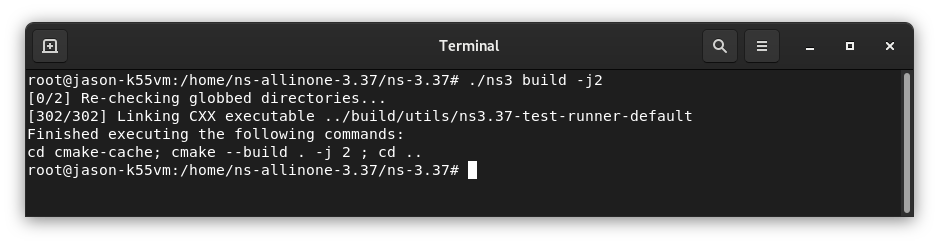
Running an Example Simulation with PyViz
Run the tutorial example ‘fist.cc’ with visualizer support as follows:
Now the simulation will start and open the visualizer for ‘animation output’ and wait for the user to press the ‘simulate’ button and to do other manipulation using the GUI.
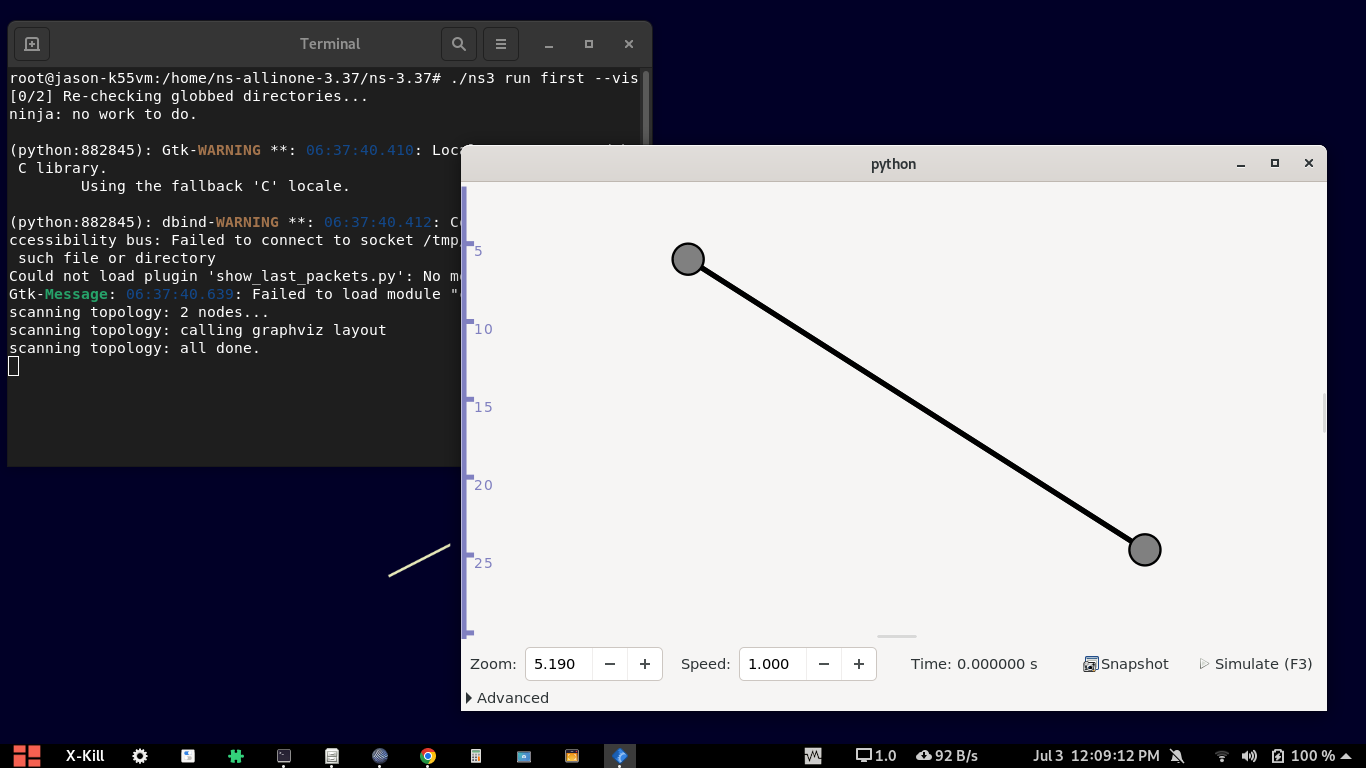
We can see some additional settings in the ‘Advanced’ option a the left bottom. In this example, we are increasing the size of the node.
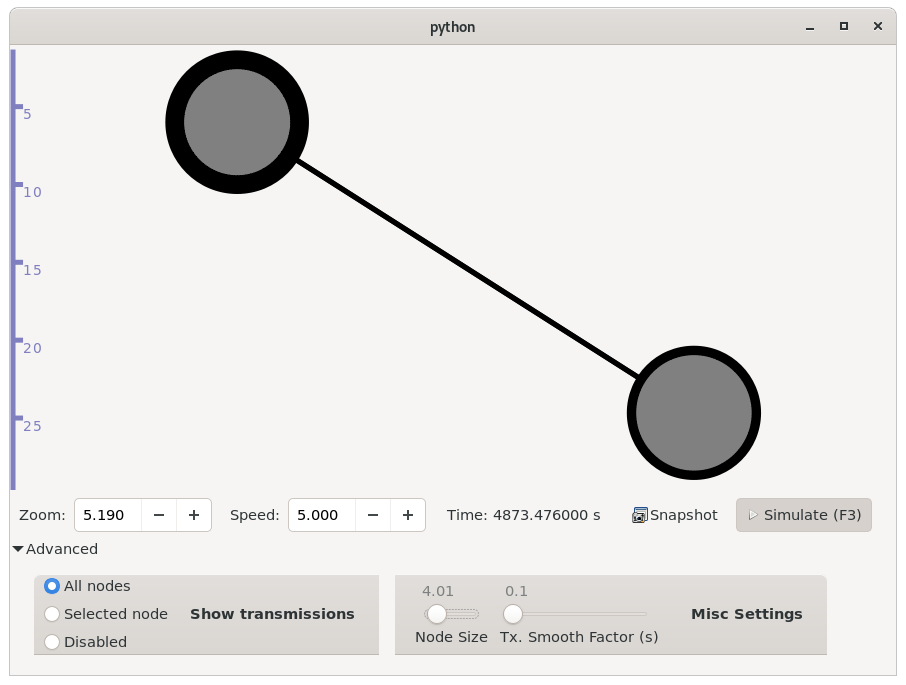
If we place the mouse cursor on a node, it will display some of its configuration information.
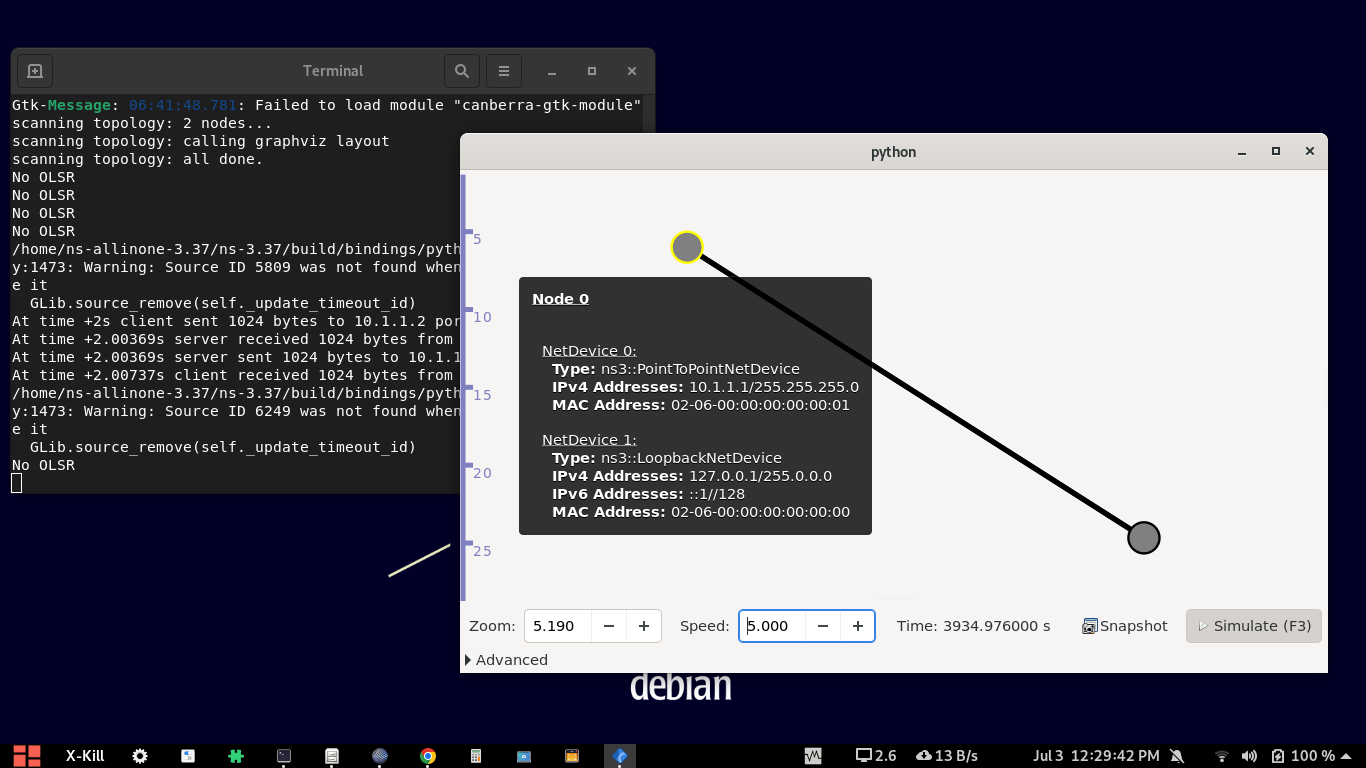
In this example output, the interface statistics and routing table statistics of the node at the top are selected to display during the simulation run.
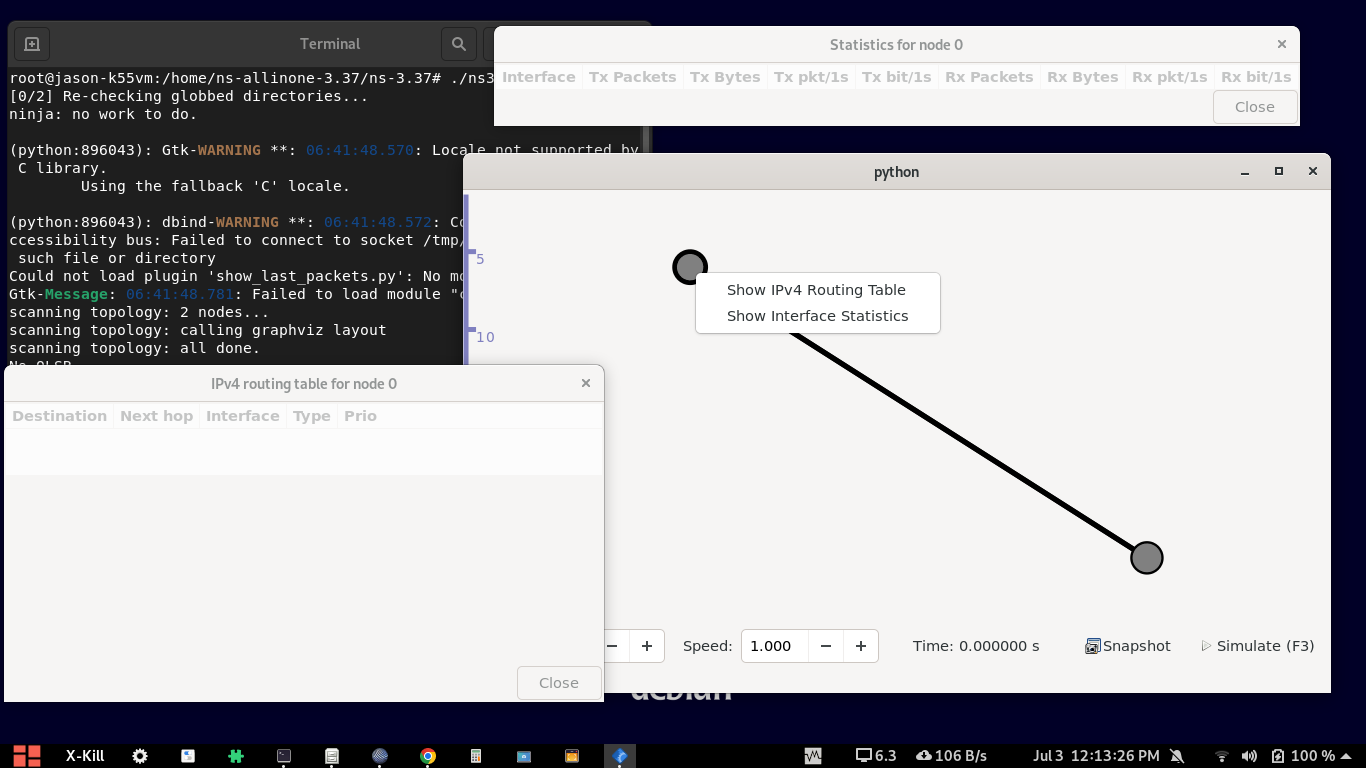
If we run the simulation, we will see the following output :
Related Articles
Installing NetSimulyzer 3D Visualization Tool under Debian 11
Conclusion
Of course, PyViz is an excellent Interactive Visualization tool for ns-3. It can be used to visualize 2D network scenarios in an Interactive manner. Will it be possible to make it more usable for the purpose of visualizing a 3D network scenario?
Up to now, could not see any such example ns-3 simulations that trying to use it for visualizing a 3D network scenario. Of course, it may be possible with the present PyViz itself – I do not know. The developers of the ns-3 PyViz only confirm this.
Future Scope
Could ns-3’s(?) PyViz can be used to visualize 3D network scenarios?
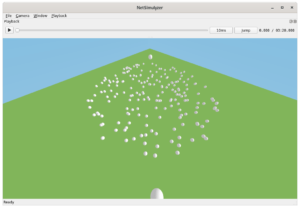
I noticed an interesting 3D visualization tool called PyViz3D. It is a web-based visualizer for 3D objects and point clouds. That tool also seems to be using the original PyViz(?) core project, but for making a 3D visualization tool out of it. The following is one such output of that tool:

It is blazingly fast even on a web browser and was able to render a 3D scene without any lagging. One may check a demo at [2]. It shows some theoretical possibility to make a 3D-Ns3PyViz, an Interactive 3D Visualization tool that will work similar to NetSimulyzer but in an interactive manner without using any trace output files.
If the authors of PyViz (ns-3) are seeing this post, then they can think about that possibility or tell something about the present capability/possiblity of ns-3’s PyViz in this regard.
References
- https://www.nsnam.org/wiki/PyViz
- https://coe.northeastern.edu/research/krclab/crens3-doc/classns3_1_1_py_viz.html
- https://www.nsnam.org/tutorials/consortium13/visualization-tutorial.pdf
- https://www.projectguideline.com/visualizing-ns-3-simulation-using-netanim/
- https://www.nsnam.org/docs/release/3.29/models/singlehtml/index.html#document-animation
- https://github.com/francisengelmann/PyViz3D
- https://francisengelmann.github.io/pyviz3d_examples/normals/index.html
 Take Me to Afarion ns-3 iPlayground